

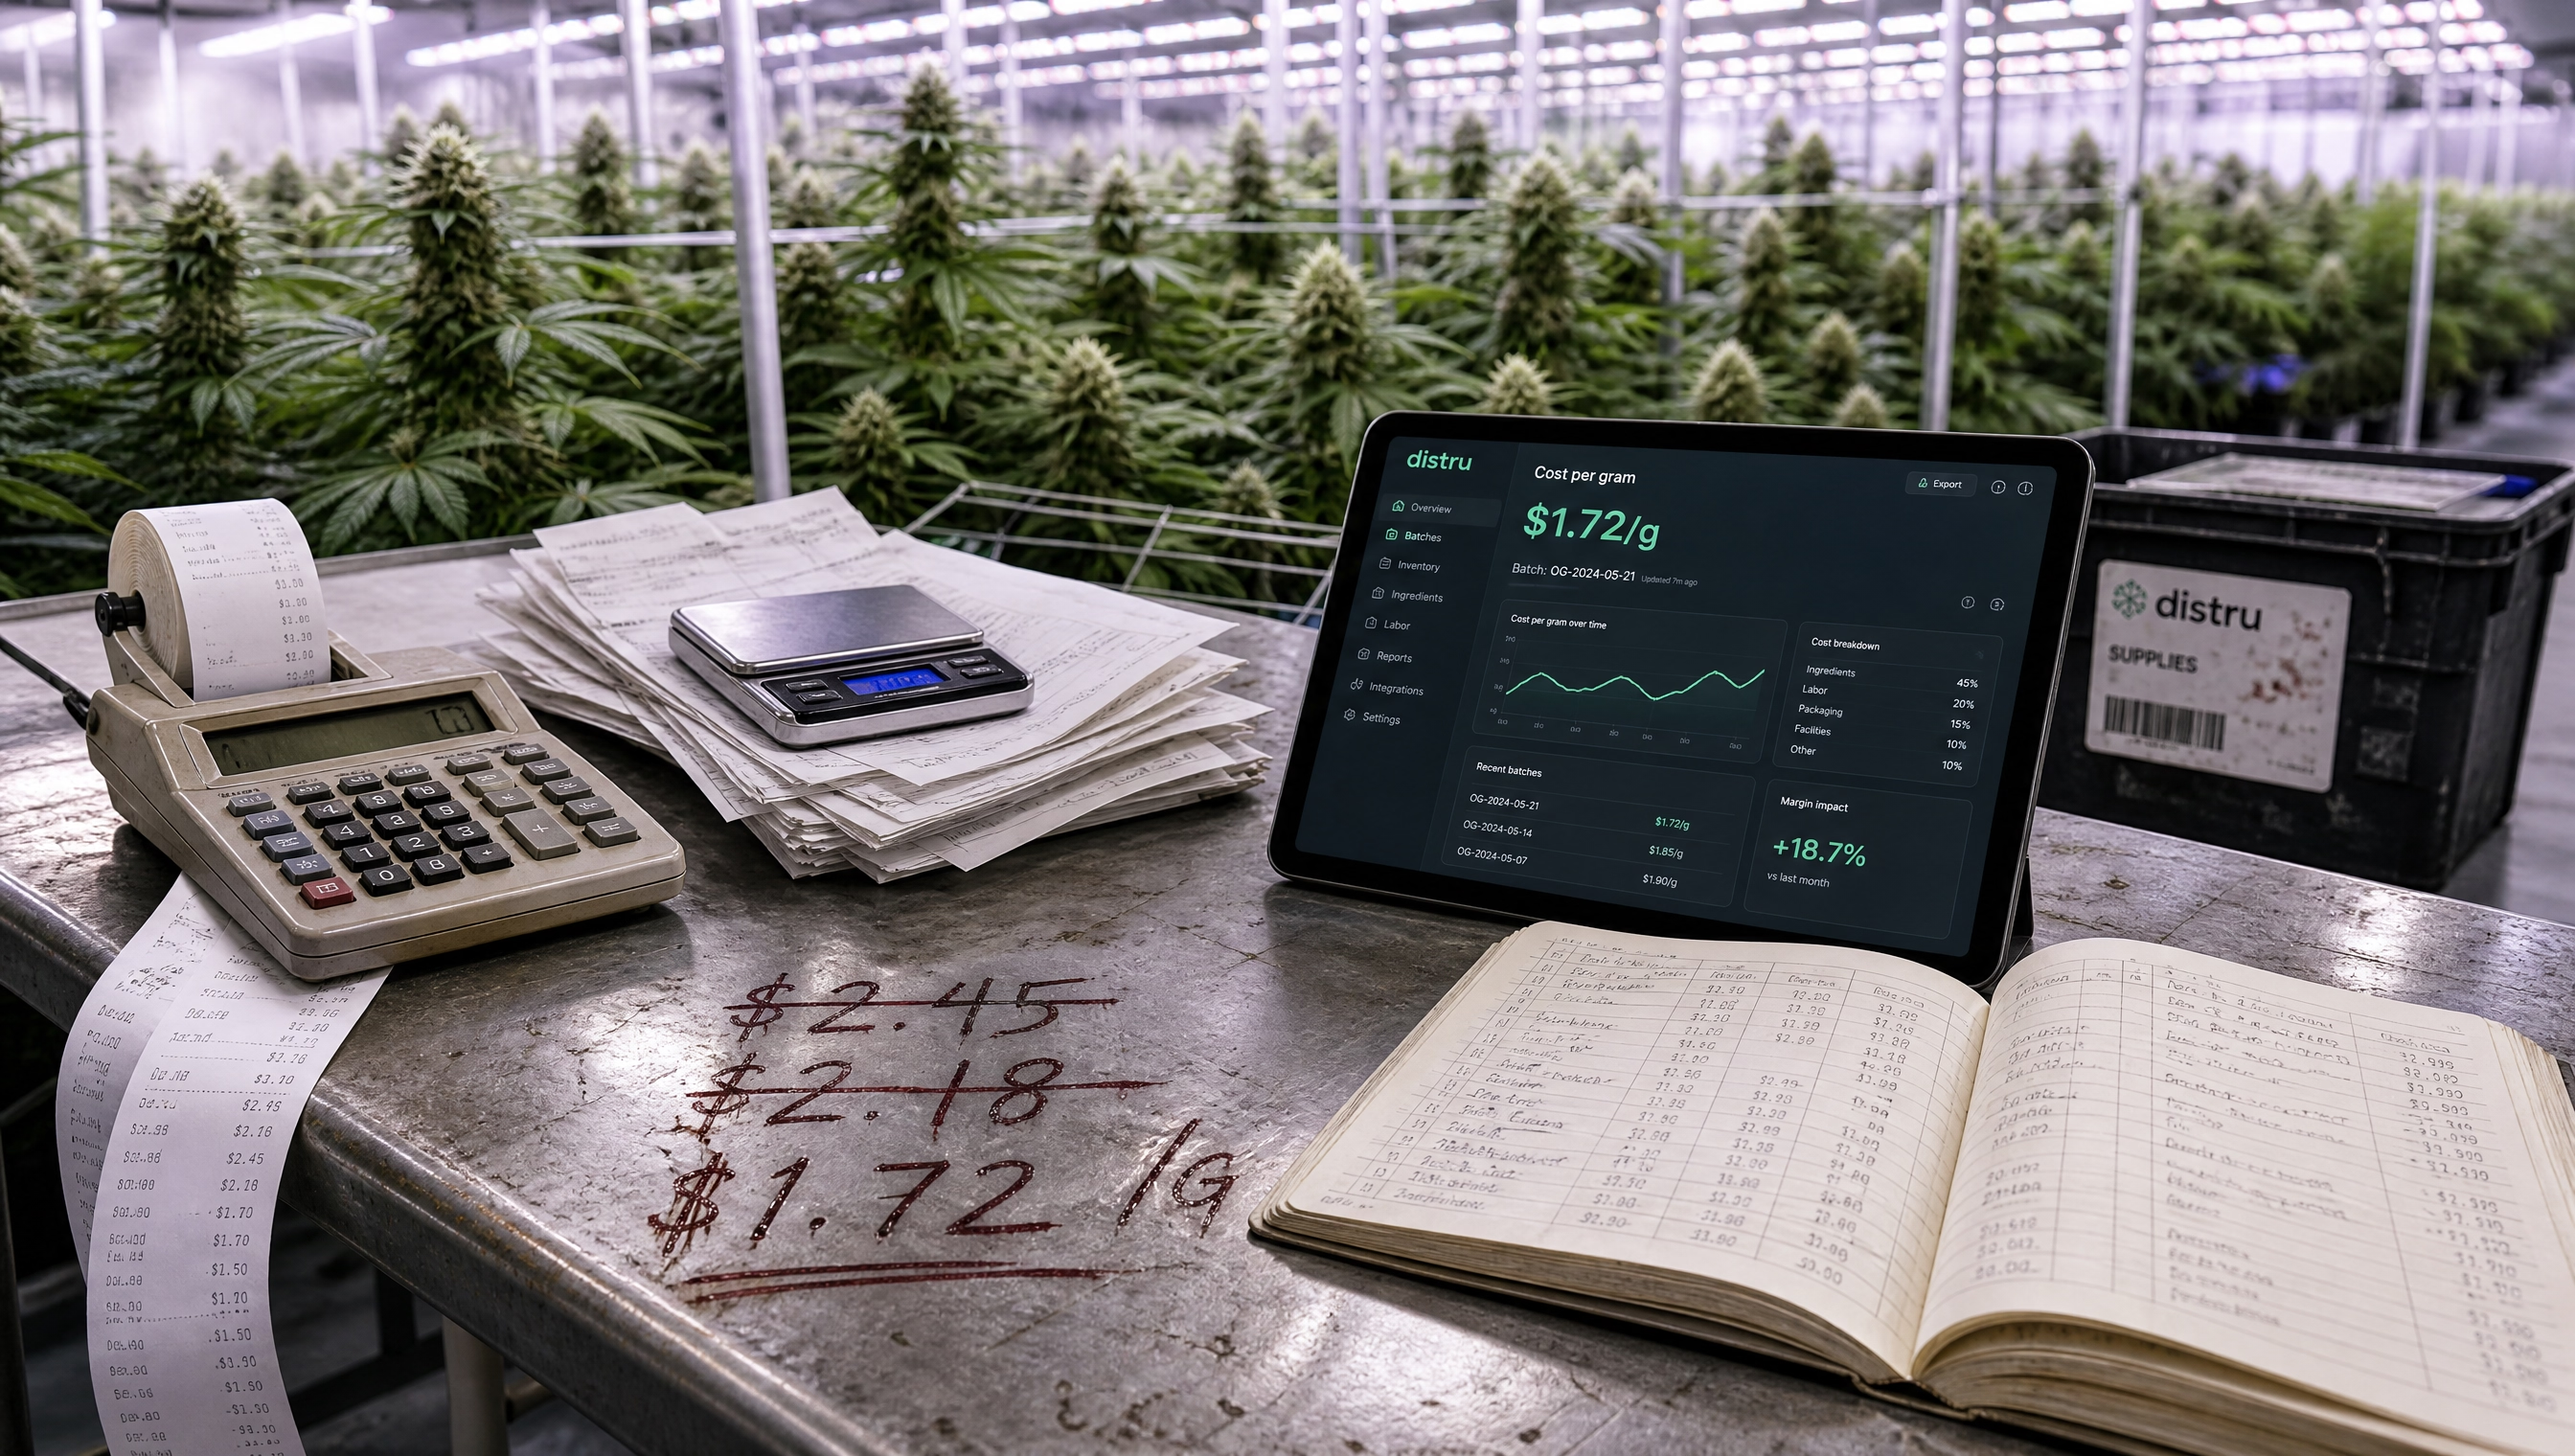
You're staring at the product you have to price. Your gut says one thing. Your spreadsheet shows another. And you're tempted to peek at the dispensary shelf down the street to see what the other operators are charging.
But the numbers in your head and the reality of your bank account don't quite line up. The figures on your screen are just a mess of formulas, and you're left wondering if you're actually making money on every sale or just trading dollars.
To get out of that cycle, you need to learn how to calculate the cost per gram of your cannabis with precision. This goes beyond the plant. You must capture every single thing that makes up your finished goods, from the initial flower or trim and packaging to the cleaning supplies and labor required during the run. This guide walks you through that process so you can know for sure if your products are actually profitable and set prices that work.

Why Cost Per Gram Is So Complicated in Cannabis
Standard accounting doesn't translate to an industry where the main product (the plant) changes its form, volume, and identity three times before it hits a shelf, especially when every step of the process is being tracked under a regulatory microscope. Even a specialized cost-per-gram calculator for cannabis can struggle with these shifting variables. Here's why:
Multi-Stage Manufacturing Changes Everything
The biggest hurdle when calculating your true cost per gram in cannabis manufacturing is that this is a multi-stage activity. You aren't just selling the plant you buy; you're transforming it. In most industries, you buy a part, add labor, and sell a product. Here, the product physically transforms and shrinks at every station.
You start with a mountain of biomass (flower or trim), which moves to extraction and gets squeezed into crude oil, then refined into a potent distillate, before finally being infused into finished SKUs like vapes or gummies. At every one of these steps, your yield drops and new materials enter the mix while your costs climb.
For example, what's the real cost per unit for cannabis edibles? To find out, you have to track the changes through all of those steps.

Analyzing Manufacturing Cost Per Unit for an Edible
- Stage 1: Biomass (The Start)
- Input: You purchase 10,000g of trim at $0.40/g ($4,000 total).
- Current Value: $0.40 per gram.
- Stage 2: Extraction (The Crude Oil)
- The Shift: You perform cannabis extraction with CO2 or ethanol, achieving a 10% yield. After the process, your 10,000g of plant is now only 1,000g of crude oil.
- Added Costs: ~$1,000 for labor, solvents, testing, and utility costs (power/HVAC).
- New Value: Your total is now $5,000 ($4,000 biomass + $1,000 extraction). Divide by 1,000g, and your cost is now $5.00 per gram of oil.
- Stage 3: Refinement (The Distillate)
- The Shift: You refine that crude into high-purity distillate, achieving a 70% yield. You're left with 700g of product, which tests at an industry-standard potency of 80% THC.
- Added Costs: ~$600 for lab tech time, testing, and consumables.
- New Value: Your total cost is now $5,600 ($5,000 crude value + $600 refinement). Divide by 700g, and the distillate now costs $8.00 per gram.
- Stage 4: Infusion (The Finished Edible)
- The Shift: To hit a standard market dosage of 100mg of active THC with 80% pure distillate, each edible needs 125mg of the product. You use those 700g (700,000mg) of oil to infuse 5,600 chocolate bars or gummy packs.
- Added Costs: ~$1.50 per unit for ingredients (sugar, pectin, etc.), packaging, testing, and labor.
- The Result: Each unit carries $1.00 worth of cannabis oil + $1.50 of production costs.
- True Unit Cost: $2.50 per edible.
As you can see, there's a significant difference between the cost per gram of biomass versus that of finished goods. The "gram" you started with at $0.40 becomes 20 times more expensive once concentrated into distillate ($8.00/g). Because each chocolate bar or gummy pack requires 0.125g (125mg) of that refined oil to hit its target dosage, the cannabis material alone costs $1.00 per unit. By the time that oil is infused, bagged, and ready for the shelf, non-cannabis inputs like packaging, labor, and overhead add another $1.50, pushing your final unit cost to $2.50. That's 2.5 times the value of the raw oil inside it.
.avif)
Important Note: These figures are just baseline estimates. In practice, a slight drop in yield or input purity, a change in wholesale biomass prices, or an extra hour of labor can quickly push a $2.50 unit toward $3 or higher. Factors like specific regional rates for utilities or labor, fees for mandatory testing, and the ever-changing value of ingredients and packaging can add to your final unit costs.
Compliance Makes Financial Tracking Harder
Our industry's strict regulatory requirements can also clutter your financial books. In most states, you're tied to Metrc. The mandatory track-and-trace system creates a complete chain of custody for every cannabis product and keeps regulators happy, but it comes with costs. Between monthly subscriptions of $40 to $50, plant and package tags that range from $0.25 to $0.45 each (or slightly higher in markets like Montana), retail IDs priced at $0.10 per unit, and shipping fees for the physical stickers, the overhead stacks up quickly.
While a few states might absorb these expenses into licensing fees, most operators are stuck paying for every single requirement. You may also have to shoulder heavy indirect costs, such as the specialized labor of the compliance manager needed to operate the system or reconcile physical inventory with digital records, hardware like RFID scanners, mandatory third-party lab testing, and waste destruction services, which don't produce oil but are required to legally sell it.
.avif)
The thing is, Metrc wasn't built for business; it was built for policing. It doesn't do costing or analyze your margins. This is why you often find yourself entering data into three or more platforms. You report in Metrc, track all those costs in QuickBooks, and rely on a spreadsheet to connect the two.
This is prone to errors and provides zero visibility into your operations. To stop the bleeding, you can invest in third-party software (ERP, cost-tracking solution, POS, or cultivation management platform) to automate the data flow, but their subscription fees are yet another operating expense you need to factor in.
What "True Cost Per Gram" Actually Means
As mentioned, when you're costing out a cannabis SKU, you have to look past the invoice for the raw material and break down every cent that touches the product before it hits the shelf. Here's what goes into it:
Direct Inputs (The Obvious Costs)
These are the tangible components that physically end up in the box. Let's look at an example: How do you calculate the true cost of a vape cartridge? We have to account for:
- Cannabis Material: Whether you're using distillate or live resin, you have to track the exact cost per gram of the oil filling the hardware.
- Hardware: This encompasses the cartridge itself, the mouthpiece, the internal coil, and any integrated batteries.
- Packaging Materials: Think beyond the box. This includes the individual unit packaging, bulk shipping cases, and even the tamper-evident stickers.
- Ingredients and Additives: This covers your terpene blends and any additional thinning agents or flavor-stabilizing additives. Every drop matters here.
Adding up these variables gives you your baseline cannabis cost per unit, but this is just the start. Most operators struggle to find a "true" number because they only track what shows up on an invoice.
"Price" and "utilization" aren't the same thing. For instance, if a batch has a high failure rate, those leakers represent hardware, oil, and labor costs you've already paid for but can't recover. Similarly, even if you pay for 1,000g of oil, you never get 1,000g into cartridges. You have to factor in "line loss" (the oil trapped in equipment), as well as "overfill," where you fill a 0.5g cart to 0.52g to ensure you pass state weight compliance.
Mandatory testing is another example. When you physically pull a 5g to 10g sample out of a batch for the lab, that product is gone forever. It generates zero revenue, but the cost to produce those grams must be absorbed by the rest of the units in that run. You should account for compliance destruction. Otherwise, your cost per unit will always look artificially lower than it actually is.
Also, you aren't just buying oil; you're buying milligrams of cannabinoids. Suppose the potency of your distillate drops from 90% to 82%. If you don't calculate the cost per mg of THC within that oil, you'll be paying the same price for 80mg less of your active ingredient. This raises your cost per unit and shrinks your margins, even if the invoice never changes.
If you aren't logging these physical losses and yield variances the same way every time, your data becomes unreliable, and your margins will never reflect reality.
Indirect Inputs (Where Margins Get Distorted)
These expenses don't always appear on a BOM, but they're the reason many operators stay in the red despite high sales. Without proper overhead allocation in cannabis manufacturing, it's impossible to tell if a specific SKU is actually profitable or just draining your cash flow.
Continuing with our vape cartridge example, you have to layer in these "invisible" costs:
- Labor: This isn't just the hourly rate of the person operating the filling machine. It's the supervisor's time, intake logistics, and the "ghost" hours spent on setup and teardown.
- Facility and Utilities: Every product carries a share of the rent and the heavy energy costs from extraction and specialized HVAC. If a cartridge requires climate-controlled storage or high-voltage power, those expenses belong on its balance sheet.
- Testing and Compliance: Mandatory lab results are another fixed cost for every batch. Also, if a run fails and requires remediation, those secondary processing costs must be charged to that specific batch.
- Packaging Price Variance: This isn't just the average cost of a box or jar, but the price difference between a 10,000-unit bulk discount and a high-premium rush order of 500. Your data must reflect the actual price paid per run to prevent drifting margins.
The money is already gone. You might as well know where it's going.
The Old Way: How Operators Were Calculating Costs Before
Did it ever feel like your data was so fragmented that it lived in three different universes? It wasn't a lack of effort. That disconnect was just the consequence of using software that was never built for cannabis production.
Before you had a unified system, you were likely forced to piece together your margins using a manual, high-friction workflow that looked something like this:
- Disconnected Systems: Your cannabis inventory was locked in Metrc, your packaging and non-cannabis materials lived in a spreadsheet, and your actual financial records sat in QuickBooks. But these systems never talked to each other, so you spent hours manually updating each one and never had a single source of truth for your operation.
- Triple Data Entry: This was the biggest time-sink. For every single sale or transfer, you had to create a manifest in Metrc, generate an invoice in QuickBooks, and then update your inventory spreadsheet by hand. With dozens of transactions a week, a single typo was enough to wreck your entire month.
- No True Per-Unit Visibility: You knew your total spend and total revenue at the end of the quarter, but calculating the fully loaded cost per SKU for a single gummy or vape cart? That was anyone's guess. Without hard data, you priced based on market trends or gut feel and just hoped the margins were there.
- Split QuickBooks Accounts: If you operated multiple license types, you likely had to run two separate QuickBooks accounts just to keep the data clean. However, the software simply didn't split inventory by license type, doubling your administrative workload and making it really difficult to get a total view of your company.
- Averaged Packaging Costs: Packaging prices fluctuated, sometimes even between orders. A jar cost $0.08 in June and $0.10 in September. You averaged these numbers or just ignored the difference entirely, leading to inaccurate COGS calculations for your cannabis products.
- No Defensible Inventory Valuation: When an investor or a lender asked what your inventory was worth, you had to give an estimate. There was no way to prove that the physical products on your shelves actually matched the dollar amounts on your balance sheet, leaving you with no verified, real-time value for your business.
The Modern Costing Workflow (Step-by-Step)
The days of fragmented data are over. Today, all the parts of your business speak the same language. You just need the right tools and workflows to automate the hidden math of manufacturing and give you a real-time, defensible look at your margins without the manual labor. Here's what to do:
Step 1: Attach Costs at the Point of Receiving
To find your true cost per gram, you must assign a value to every input during the intake process. The goal is to lock in the actual price you paid before that inventory ever touches your production floor.
Within Distru, for instance, you can choose how to track these costs based on the material:
- Package Track (Cannabis, Imported from Metrc): For plant material (flower or trim), concentrates, or pre-rolls, you enter the cost per gram or unit during the initial import. If you receive 1 lb of trim at $0.40/g, Distru automatically tags that package with a total value of $181.44.
- Batch Track (Non-Cannabis, Recorded as PO): Distru uses batch costing for cannabis packaging (cones, tubes, labels, jars, bags) and hardware. Every PO creates a unique batch with its own unit cost. If you buy jars for $0.08 in June and reorder them for $0.10 in September, the system tracks them separately. It preserves the variance between orders and shows exactly what you paid for the materials used in every run, not an average of your last three years in business.
- Product Track (Consumables, Optional at Import): For items like cleaning supplies or trash bags that you don't track per unit, you simply allocate the cost to overhead. This captures the expense of the run without overcomplicating the calculation.
If your data isn't ready at import, you can start with your daily operations and backfill these costs as you go. The system lets you add those details in stages.
Step 2: Run a Production Assembly (Work Order)
An assembly is essentially a digital version of your real-world work order. You tell the system what went in (cannabis, packaging, and consumables) and what came out as finished SKUs after the manufacturing process.
A typical assembly for a pre-roll run looks like this:
- Inputs: 2 lbs of cannabis flower + 2,000 pre-roll cones + 2,000 tubes + 2,000 labels (all with costs already attached)
- Output: 2,000 finished pre-rolls, each assigned a new Metrc package tag
Since every input already has a value attached, the costing of your cannabis work order becomes automatic. Modern tools like Distru calculate the total and divide it across finished units to produce the true cost per SKU.
Step 3: Understand COGM vs COGS
For effective cost accounting in cannabis manufacturing, you also need to distinguish between what it costs to make the product (COGM) and what it costs to sell it (COGS). Getting this distinction right is your primary defense against the financial impact of Section 280E.
Under this tax code, you can't take standard business deductions if you operate in the adult-use or recreational market (note: ongoing federal rescheduling can soon change this). This means a massive chunk of your tax burden is tied directly to how you value your inventory, and your only relief comes from your COGS.
As a manufacturer, you can leverage Section 471 to legally capitalize your full manufacturing costs, such as direct materials, labor, utilities, and facility rent, into your inventory asset valuation (COGM) while you make the product. When you finally sell those finished goods, that capitalized amount transitions into COGS, which is the only metric you can legally use to reduce your overall taxable income.
Distru, for example, tracks both:
- COGM: Found in the Inventory Assets Report, it captures all assembled products with full production costs, expected final prices, and projected margins before a sale occurs. Use this to guide your pricing and see exactly how profitable a product will be before you ever send it out the door.
- COGS: Tracked via the Cost of Goods Sold Report, it reveals your actual margins on sold products, detailing how prices changed after discounts, delivery fees, and adjustments. Use this for your monthly close to identify margin erosion and see the difference between what you planned to make and what you actually took home.
Together, these reports provide the foundation for accurate cannabis margin analysis.

Step 4: Run Inventory Valuation
Investors, lenders, and accountants want to see a hard dollar figure for your business's health. That's why you need an Inventory Valuation Report that replaces your cluttered spreadsheet full of estimations with defensible numbers.
Distru, for instance, provides a live snapshot of every gram and unit at its actual cost. This data gives you the financial proof required for insurance audits, investor presentations, and tax filings. Since you track your capital and production in the same system, your balance sheet stays accurate and ready for review with no extra effort.
Cannabis Manufacturing Cost with Distru
By now, you've seen how messy it gets. You're dealing with strict regulations, multiple license types, Metrc requirements, fluctuating supply costs, and the inevitable yield loss in cannabis production.
It's a lot to hold together, especially if you're doing it manually.
Distru solves this by bringing your operations, compliance, and accounting into the same system. You keep running the business; the numbers just follow.
How Distru Improves Cannabis Cost Calculation
| Challenge | What Happens Without Distru | How Distru Solves It | Why It Matters |
|---|---|---|---|
| Cannabis tracked in Metrc, packaging tracked separately |
Costs live in different systems; no unified view
|
Cannabis (package track) and packaging (batch track) live in one system, with costs attached
|
True cost per SKU includes both cannabis and non-cannabis inputs |
| Packaging prices fluctuate between orders |
Operators average costs or ignore variance
|
Each PO creates a new cost batch; production pulls actual batch cost
|
COGS reflects real material prices, not blended estimates |
| Manual production cost math |
Spreadsheets required to divide inputs across outputs
|
Assemblies automatically roll up all input costs and calculate the cost per finished unit
|
No manual calculations, fewer errors, faster decisions |
| Triple data entry (Metrc + QuickBooks + spreadsheet) |
High error risk and time drain
|
Enter data once; Distru syncs it to Metrc and QuickBooks when you're ready
|
Saves hours weekly and keeps systems aligned |
| No visibility before products are sold |
Margin only known after sale
|
Inventory Assets Report shows projected margin before sale
|
Pricing decisions based on real numbers |
| No defensible inventory valuation |
Estimated inventory value
|
Inventory Valuation Report shows real-time dollar value of inventory
|
Clean reporting for investors, lenders, and accountants |
| Difficulty tracking transfers between internal licenses |
Manual cost reconciliation between grow and processor
|
Cost stays attached to the Metrc package when it transfers between licenses
|
Internal transfers don't distort margins |
| Labor and overhead guessed or ignored |
Incomplete "cost per gram" calculation
|
Labor and overhead can be layered into assemblies and included in cost roll-ups
|
Fully loaded cost per SKU, not partial cost |
What Changes When You Finally See True Cost Per Gram
When you finally stop guessing, you start making pricing decisions with confidence because you know exactly where your break-even point sits. You can look at your product margins and realize that while your high-end flower looks great on your menu, the mid-tier pre-rolls are actually the ones paying the bills.
This level of visibility lets you stop the bleeding early. If a new extraction tech is losing 5% more yield than the last one, you'll see it in the data before it ruins your quarter. It also changes the way you talk to the bank or your board. Instead of saying, "We think we're doing well," you're showing them clean, professional reports that prove you know exactly what it costs to make your product and exactly what your inventory is worth.
Conclusion: Cost Visibility Is Operational Control
Between stringent regulations, market volatility, and increasing competition, running a cannabis business is hard enough. Your financial visibility shouldn't feel like another weight. Your true cost per gram isn't just another figure for the accountants; it's how you actually take control of your bottom line.
When you connect your operations, your compliance, and your costs, you gain more than just data. You finally know your numbers. You gain the freedom to grow.